


Not long ago, reading through application logs was a simple process. A typical log diving sessionwould include me SSHing onto a host or hosts, navigate to the log directory, and run a series of commands like grep for searching, awk for formatting, and cut/count for summing. With basic knowledge of these three commands—and a cheat sheet at your steady—you could pull out nuggets of insight from your log files.
Once you spent a couple hours learning these commands well, you could apply them to other purposes like bash scripting or writing command line prompts. These classic commands were multi-purpose—you would learn them once, and use them repeatedly during general computing tasks.
With the move to cloud computing, log diving feels like it has taken on a different form entirely. If you’re still living in a world where you can SSH onto a box and do your business, I envy you. But most of us that have embraced the cloud now find ourselves in a world where needing to log dive means learning a new technology specific language built just for that platform. Take ElasticSearch / OpenSearch for example – a powerful NoSQL based data store often used for log searching and visualizing purposes. ElasticSearch uses a custom developed Query DSL (Domain Specific Language) to express your queries that drive your dashboard visualizations. CloudWatch, another AWS logging product, uses it’s own proprietary search expression syntax to perform queries. These are just two examples, but there are many more logging technology choices forcing developers to make use of custom DSLs.
In my opinion, needing to learn the product specific syntax for each of these technologies is a colossal waste of developer time. We need standards, or at a very minimum, a way for us to speed up translating query needs into technology specific syntax while at the same time minimizing learning overhead. Using AI to drive query translation feels like a perfect match, and services like AWS CloudWatch are getting a head start.
CloudWatch Query Generator
Buried in the details of this year’s AWS re:Invent conference was a small feature announcement that takes the first step towards AI based query translation. The AWS CloudWatch team announced AI-powered natural query generation, a new enhancement that converts your provided natural language command into the corresponding CloudWatch specific syntax. You can say “give me all the log lines containing errors” and CloudWatch will generate the following:
fields @timestamp, @message, @logStream, @log
filter @message like /ERROR/
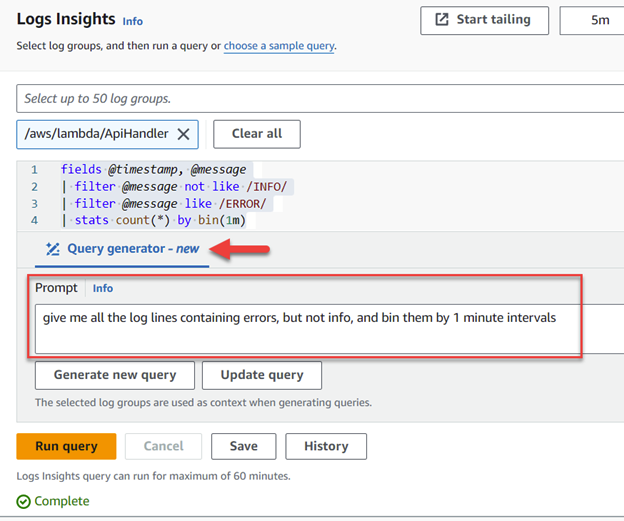
| sort @timestamp descYou can throw even more complicated requests that use conjunctions, and time series binning like “give me all the log lines containing errors, but not info, and bin them by 1 minute intervals” which produce accurate conversions:
fields @timestamp, @message
| filter @message not like /INFO/
| filter @message like /ERROR/
| stats count(*) by bin(1m)
You can clearly see the utility of this feature, proving a free way to generate the right syntax for what you’re trying to do. Here’s a screen grab of the console experience. Providing the natural language description of my query in the Prompt section and clicking Generate new query updates the search field with the corresponding translation.
Previously, my realization that I needed to log dive through CloudWatch were immediately met with feelings of dread and the anticipation of a frustration packed afternoon. I would typically reach for the documentation, examples, and in the worst-case consult colleagues before I was finally able to concoct the right combination of syntax through a timely ordeal involving more trial and error than I’d like to admit. The experience was frustrating to the point where I would keep a growing cheat sheet of query commands for common use cases. Most of my developer colleagues shared the same complaints.
It feels like AWS realized the user frustration too. By including a Save and History function to keep track of past queries, AWS was subtly hinting “we know this stuff is confusing, here’s a place you can keep a journal of what worked in the past, so you don’t have to re-learn It each time”. Or maybe, I’m reading into their intentions a bit too much and should just move on and say, “thank you for the quality of life feature”.
Despite these complaints of the old experience, the new Query Generator feature is a welcome addition to log diving in CloudWatch. You no longer need to be proficient in CloudWatch Log Insight’s SQL-Like syntax and can instead rely on the Query Generator. The feature is free to use, but only applies to the CloudWatch Logs Insights product, which is a tool that lets you search over vast quantities of CloudWatch data all in one go.
I found that in my experimenting, the Query Generator produced the right result 100% of the time, and using it even taught me a thing or two about the syntax that I could use to form my own custom written queries. But with Query Generator now in hand, I doubt I’ll need to draw on that knowledge often.


In your first example, I believe it wouldn’t give you just lines containing errors, but just the first 20 lines.
fields @timestamp, @message, @logStream, @log
| sort @timestamp desc
| limit 20
Where does it filter for errors? Is this typical of the “AI” ?
Thanks for the comment. This was a copy-paste error—I’ve since revised the output.