


One of the configuration decisions you need to make when setting up your lambda is your function’s memory settings. Memory configuration has a profound impact on not only the performance of your function, but also on cost.
For this reason, our goal as an operator of AWS Lambda should be to pick the lowest possible memory value that does not sacrifice performance.
This may sound easy at face value, but every function has different performance characteristics that can drastically affect its runtime. In other words, there’s no special rule of thumb that will help you pick the right value.
In the past, doing this manually was a nightmare. Back in the day when Lambda was in its infancy, I actually wrote my own script that toyed with my function’s memory setting in an attempt to find the most ‘optimal’ value for my function.
Lucky for you, these types of problems are a thing of the past. These days, performance optimization is made easy by using AWS Lambda Insights.
In this post, we’re going to learn all about Lambda Insights and how you can leverage it to analyze your function’s performance, detect anomalies, and optimize your function’s execution.
Lets get started.
What is AWS Lambda Insights?
Lambda Insights is a new product offered as part of Cloudwatch: Amazon’s monitoring service. Insights is a new tool that aggregates a function’s performance characteristcs that it exposes for monitoring.
Insights uses a Lambda Extension to augment the functionality of your lambda function to incorporate a monitoring agent. The agent is deployed alongside your Lambda as a Layer that collects and emits system level information, and outputs a log line containing summary statistics.
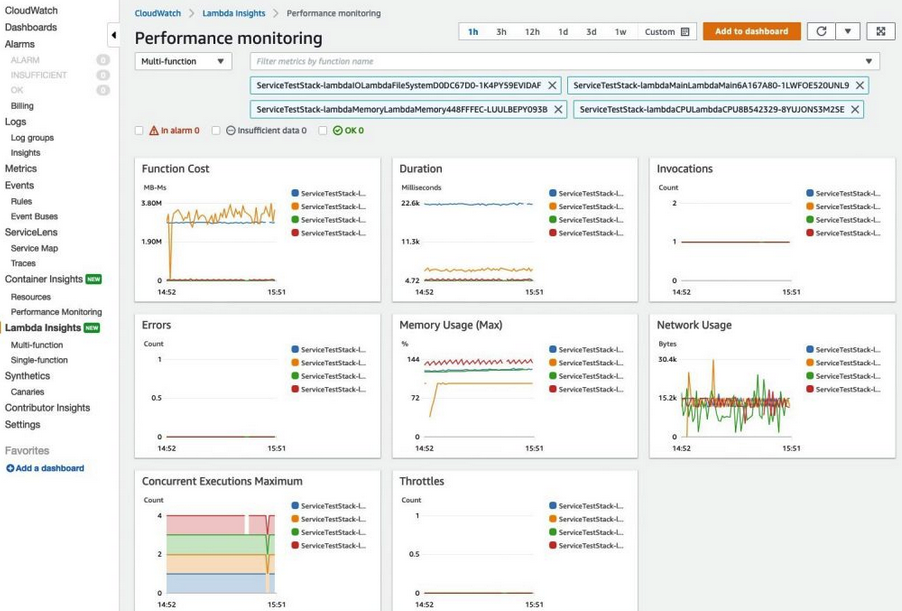
The Lambda Insights service collects and aggregates this log data in order to provide useful performance dashboards for your function. This includes things like CPU, Memory, Function Cost, and many more. You can see an example of the Insights Performance Dashboard below.

It even collects information about Cold Starts which are notorious for drastically affecting a function’s initial executions after a period of downtime.
The above was using the single-function category of monitoring. With multi-function monitoring, we can analyze metrics across multiple lambda functions at once, as seen below:
One other thing to note is that Lambda Insights does not have any explicit cost other than the logs that are emitted to Cloudwatch as a result of enabling the tool. As a quick reminder, Cloudwatch logs cost $0.50 per GB of information.
How To Use These Metrics To Optimize Your Function
At face value, these metrics tell you a lot about how your function is performing. But how do we actually use this information to get any meaningful performance boost?
The key is in observing Trace Maps. Trace Maps are traces of a instance’s execution. They contain function profiling information for configurable functions and can be used to determine what exactly in a function is slowing it down.
Take a look at this invocation’s segments. One particular segment is consuming a large amount of runtime.
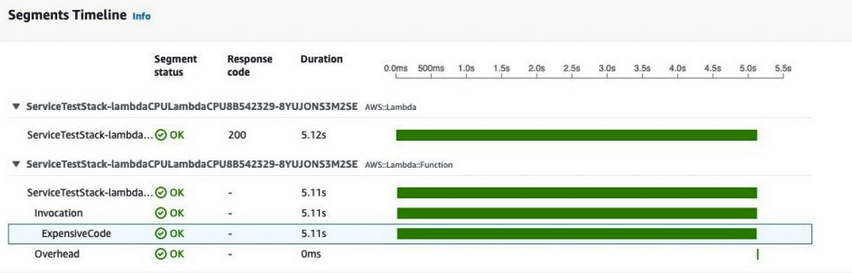
It turns out, this segment is wrapped around a piece of code that runs a Fibonacci sequence – a particularly expensive computation that is memory bound. Note that this information will only be present (the trace and the segment) if you have AWS X-Ray enabled – so if you’re not seeing it, that’s the reason.
Using this information, you can go and toy with your memory configuration setting and analyze the new traces. You can play around with the value and observe the trace to find the right memory value that balances performance and your budget.
Other Tools For Performance Optimization
Although Lambda Insights is a useful tool for analyzing a function’s performance, there is still manual, trial and error type work that needs to be done by the user to determine the right memory value.
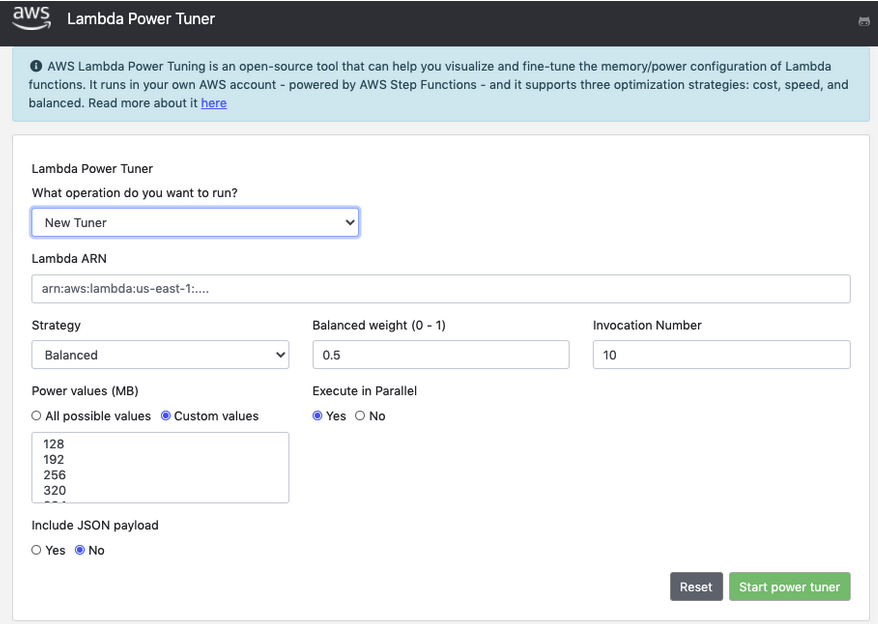
An EXTREMELY useful tool is one called AWS Lambda Power Tuning. In fact, its go good its recommended in the official AWS Lambda Operating Guide.
The tool essentially uses an AWS Step Function to continuously adjust the memory setting of your lambda function, and invoke it a bunch of times to collect performance data. The memory settings to use and the number of invocations to run are configurable through the tool’s awesome UI as seen below.
After specifying your preferences and running the tool, it will output a performance graph summarizing execution time, memory use, and total cost across the range of memory values that it tested as seen below.
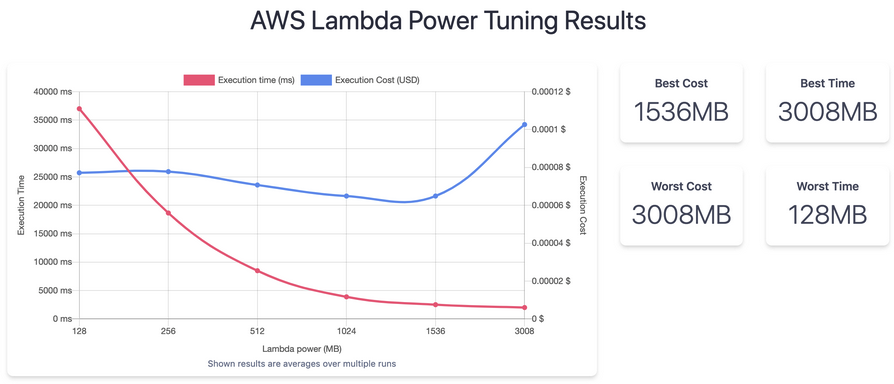
Armed with this information, we can then pick the best value that performs at an acceptable level, and also doesn’t waste resources. This is critically important for minimizing the cost of our functions, especially in high throughput applications.
You can give AWS Lambda Power Tuning a try by following the instructions here.
Summary
Lambda Insights is an important tool that helps operators understand the performance characteristics of their Lambda functions.
Using this information and tools such as Power Tuning, we can help decide the optimal memory configuration value that minimizes cost and maximizes performance.


